profcurv
profcurv
Profile curvature calculation using a DEM
Result = profcurv(dem)
- dem
- spatial scalar
- Result
- spatial scalar
Options
--unittrue or --unitcell (see also notes)
- --unittrue
- horizontal and vertical scale is measured in true distance; values on dem are interpreted as real heights (default).
- --unitcell
- horizontal and vertical scale is measured in number of cell lengths; values on dem are interpreted as number of cell lengths.
Operation
Calculates the profile curvature (i.e. the curvature in the direction of the slope) on the elevation map dem. For each cell, the curvature is calculated in a 3 x 3 cell window, where the cell under consideration is in the center of the window.
The profile curvature on Result is the change in slope per distance in horizontal direction, in direction of the slope. It is negative at concave slopes and positive at convex slopes. The slope is dZ/dX, which is the increase in height (vertical direction dZ) per distance in horizontal direction (dX). The profile curvature is the change in slope per distance in horizontal direction, so it is dZ/dX 2. For a correct calculation of the profile curvature, the scale for the horizontal distance on dem and the vertical distance (height) on dem must be the same and the global option --unittrue must be set (it is default). In that case, the scales of Z and X correspond and the profile curvature on Result is in 1/dX.
The profile curvature is calculated according to the equation given by Zevenbergen.
Notes
If a cell has a missing value on dem, a missing value is assigned to Result, in any case.
For each cell, the profile curvature is calculated using its 8 neighbours in a 3 x 3 cells window. Elevation in all these cells must be known, else the profile curvature calculation can not be performed. It may occur that one of these values is unknown: this is the case if a surrounding cell is a missing value or if the centre cell is at the edge of the map resulting in the absence of some surrounding cells. If this occurs the profcurv operator uses a built in neighbourhood interpolator to fill these missing values or absent cells in; this will make calculation of the profile curvature for the centre cell still possible. For each missing value cell or absent cell, the elevation is determined by taking the average elevation of non missing value cells in a 3 x 3 cell window, with the missing value cell or absent cell in the centre of the window.
Group
This operation belongs to the group of Derivatives of elevation maps
Examples
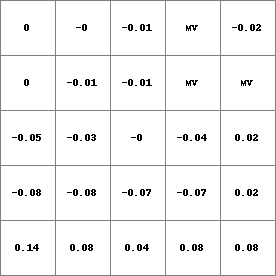
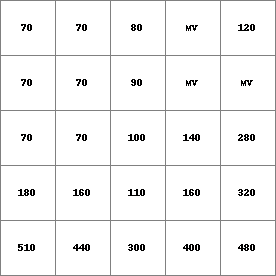
- • pcrcalcbindingResult = Result.map;Dem = Dem.map;initialreport Result = roundoff(100* profcurv(Dem))/100;• pythonDem = readmap(“Dem.map”)Result = roundoff(100* profcurv(Dem))/100
Result.map
Dem.map