Using keyword value pairs
as an example, we can define our own varargin (this is what normally would be read by the function we are calling)
varargin = {'title_text','Title text included as keyword-value pair'};
Within the function, first the default properties for all possible input arguments are set
OPT = struct(...
    'xInitial'   , (-20:10:70)', ...
    'zInitial'   , [7.62 7.49 8.26 7.91 7.72 6.03 5.41 5.26 4.82 4.66],...
    'title_text' , 'Default plot title', ...
    'xlabel_text', 'Crossshore distance (m wrt. RSP = 0)', ...
    'ylabel_text', 'Surface elevation (m wrt. NAP = 0)');
then setproperies is used to overwrite default settings
OPT = setproperty(OPT, varargin{:});
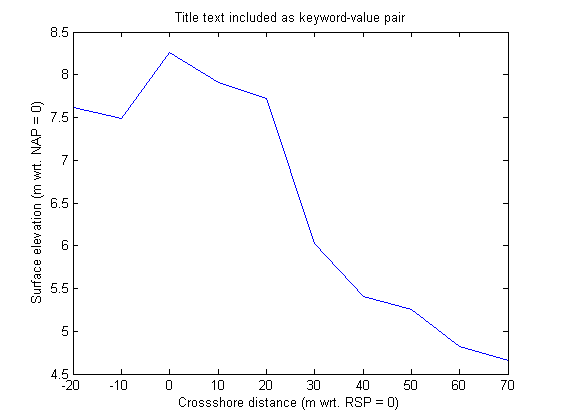
This is clear when we make the plot. Note that the default 'Default plot title' has been replaced with 'Title text included as keyword-value pair'.
figure;clf
plot  (OPT.xInitial, OPT.zInitial);
xlabel(OPT.xlabel_text)
ylabel(OPT.ylabel_text)
title (OPT.title_text)
Wrong keywords
if we define a wrong input argument, we get an error message:
varargin = {'line_spec','.r'};

try
    OPT = setproperty(OPT, varargin{:});
catch
    lasterr
end
ans =

Error using ==> setproperty at 153
PropertyName "line_spec" is not valid
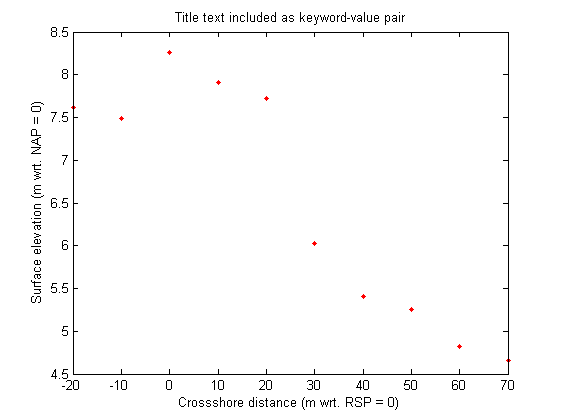
%this will only work if we include it in the function first
varargin = {'title_text','Title text included as keyword-value pair'};

OPT = struct(...
    'xInitial'   , (-20:10:70)', ...
    'zInitial'   , [7.62 7.49 8.26 7.91 7.72 6.03 5.41 5.26 4.82 4.66],...
    'title_text' , 'Default plot title', ...
    'xlabel_text', 'Crossshore distance (m wrt. RSP = 0)', ...
    'ylabel_text', 'Surface elevation (m wrt. NAP = 0)',...
    'line_spec'  , ''); %default value is empty
OPT = setproperty(OPT, varargin{:});

figure;clf
plot  (OPT.xInitial, OPT.zInitial,OPT.line_spec);
xlabel(OPT.xlabel_text)
ylabel(OPT.ylabel_text)
title (OPT.title_text)

Multiple keywords
and now with extra arguments defined:
varargin = {'title_text','Title text included as keyword-value pair','line_spec','.r'};

OPT = struct(...
    'xInitial'   , (-20:10:70)', ...
    'zInitial'   , [7.62 7.49 8.26 7.91 7.72 6.03 5.41 5.26 4.82 4.66],...
    'title_text' , 'Default plot title', ...
    'xlabel_text', 'Crossshore distance (m wrt. RSP = 0)', ...
    'ylabel_text', 'Surface elevation (m wrt. NAP = 0)',...
    'line_spec'  , ''); %default value is empty
OPT = setproperty(OPT, varargin{:});

figure;clf
plot  (OPT.xInitial, OPT.zInitial,OPT.line_spec);
xlabel(OPT.xlabel_text)
ylabel(OPT.ylabel_text)
title (OPT.title_text)