Simple case
First generate some data.
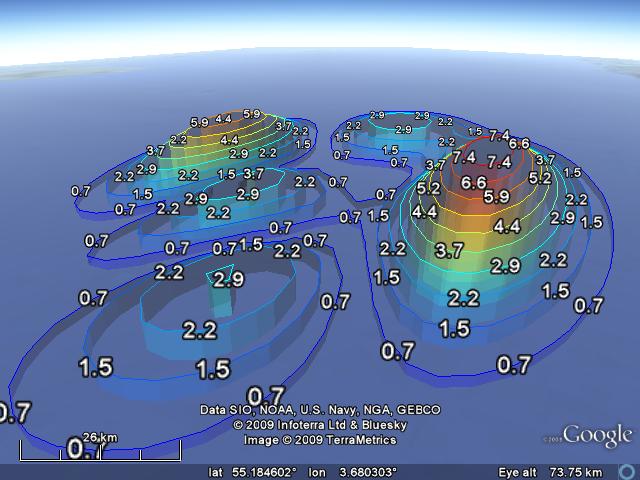
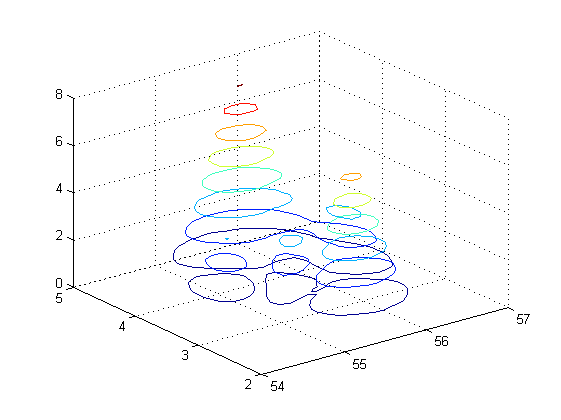
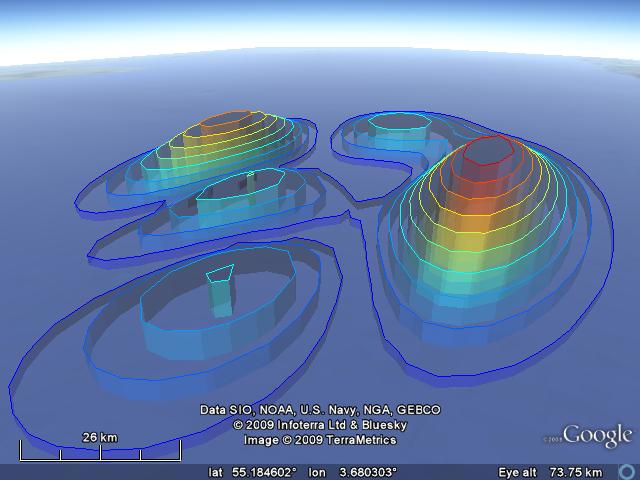
[lat,lon] = meshgrid(54:.1:57,2:.1:5);
z = peaks(31);
z = abs(z);
fname = 'contour3.kml';

% we can make a contour plot of this data in Matlab:

contour3(lat,lon,z)

% Similarly in KML. Because we really want to exagerate the height, we
% specify a zScaleFun, the anonymous functions that scaels the height.

KMLcontour3(lat,lon,z,'fileName',fname,'zScaleFun',@(z) (z+.2)*1000);
Next to the contour KML file, a labels file has been created. This file can be also be added.