ARROW3
EXAMPLES (R13)
Two-Dimensional
Quiver Plots
Example 1. (cf.
Joukowski
Airfoil Transformation)
t=10*pi/180; u=0.1; v=0.1; r=1.1; tol=8e-2;

s=u+i*v; k=2*r*sin(t); w=exp(i*t);

[x,y]=meshgrid(-2.5:0.1:3.5,-3:0.1:3);

z=x+i*y; z(abs(z-s)<r-tol)=NaN;

f=w*z+exp(-i*t)*r^2./(z-s)+i*k*log(z);

a=0:0.1:2*pi; zc=r*(cos(a)+i*sin(a))+s;

c1=-1.5; c2=2.5; c3=c2-c1;

c=contour(x,y,imag(f),c1:c3/16:c2);

set(gca,'color',0.5*[1 1
1])

hold on, daspect([1 1
1])

fill(real(zc),imag(zc),'y'),
colorbar

map=get(gcf,'colormap');

domain=0:1/(size(map,1)-1):1; m=1;

while m<length(c),
n=m+c(2,m);

  if c(2,m)>9,
p=c(:,m+1:n)';

    if
p(end,1)>p(1,1), p=flipud(p); end

    ndx=10:10:length(p);

    p2=p(ndx,:); p1=p(ndx-3,:);

    cc=interp1(domain,map,(c(1,m)-c1)/c3);

    set(gca,'ColorOrder',cc)

    arrow3(p1,p2,'0o',0.8)

  end, m=n+1;

end, hold off
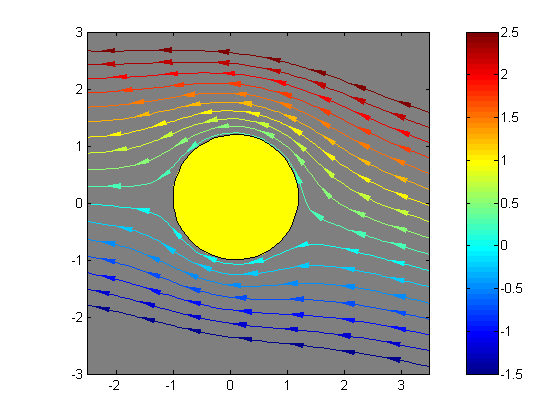
Example 1. Joukowski Airfoil
Transformation
 |
Example
2. (cf.
Quiver)
[x,y]=meshgrid(-1:1/21:1);

z=x.*exp(-x.^2-y.^2);

[c,h]=contour(x,y,z);

set(h,'EdgeColor',0.45*[1
1 1])

ndx=1:3:length(x);

x=x(ndx,ndx); y=y(ndx,ndx); z=z(ndx,ndx);

[u,v]=gradient(z,1/7);

p1=[x(:),y(:)]; u=u(:); v=v(:);

m=abs(u+i*v); % gradient
magnitude

daspect([1 1 1]), set(gca,'color',0.3*[1
1 1])

hold on, colormap hot, scale=0.4;

arrow3(p1,p1+scale*[u,v],'|',min(1.25*m,0.85))

hold off, h=colorbar;

set(h,'YTickLabel',num2str(str2num(get(h,...

  'YTickLabel'))/scale))
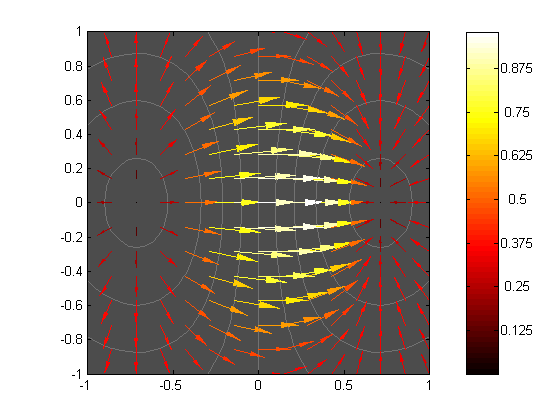
Example 2. Surface Gradients
 |
Example
3. (cf.
Two-Dimensional
Quiver Plots)
[x,y,z]=peaks(-2:0.05:2);

contour(x,y,z,10); h=gca;

ndx=1:4:length(x);

x=x(ndx,ndx); y=y(ndx,ndx); z=z(ndx,ndx);

[u,v]=gradient(z,0.2);

p1=[x(:),y(:)]; u=u(:); v=v(:);

m=abs(u+i*v); % gradient
magnitude

hold on, daspect([1 1
1]), scale=0.025;

arrow3(p1,p1+scale*[u,v],'|',0.9*m/max(m))

hold off, title('Dual Colormap')

h1=colorbar; h2=copyobj(h1,gcf);

set(h,'color',0.4*[1 1
1],...

  'position',get(h,'position')+[0.05 0 0 0])

%
----------------------------------------------------- Right Colorbar

p=get(h1,'position');

set(h1,'position',[0.87,p(2),0.05,p(4)],...

  'YTickLabel',num2str(str2num(get(h1,...


'YTickLabel'))/scale))

% freeze labels

map=colormap; cdata=reshape(map,size(map,1),1,3);

set(get(h1,'children'),'cdata',cdata)

% freeze colors

set(get(h1,'title'),'string','Gradient')

%
------------------------------------------------------ Left Colorbar

caxis auto, colorbar,
colormap autumn

set(h2,'YAxisLocation','left',...

  'position',[0.08,p(2),0.05,p(4)])

set(get(h2,'title'),'string','Contour')
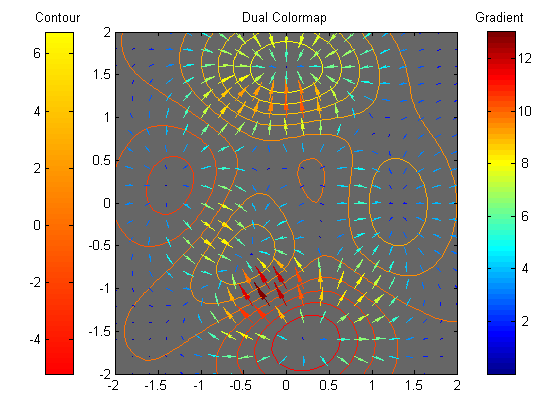
Example 3. Dual Colormap
 |
Three-Dimensional
Quiver Plots
Example 4. (cf.
Quiver3)
[x,y]=meshgrid(-2:0.25:2,-1:0.25:1);

z=x.*exp(-x.^2-y.^2);

surf(x,y,z,'EdgeColor','none')

axis([-2.5 2.5 -1.5 1.5 -1 1]), daspect([1 1 1])

set(gca,'CameraViewAngle',7)

[u,v,w]=surfnorm(x,y,z);

p1=[x(:),y(:),z(:)]; N=[u(:),v(:),w(:)];

hold on

arrow3(p1,p1+0.5*N,'1.5_b')

hold off, colormap spring

light('position',[-1 -1
-1],'style','local')

light('position',[0 1
1]), lighting gouraud
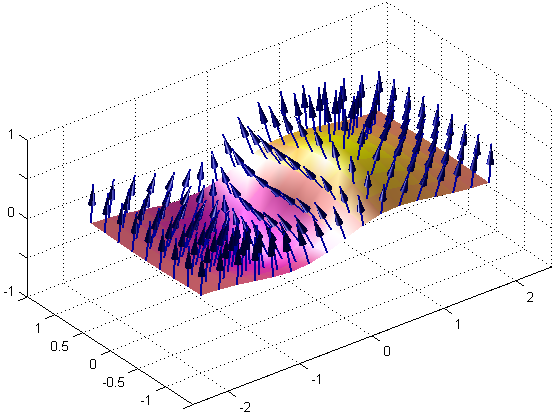
Example 4. Surface Normals
 |
Example 5. (cf.
Three-Dimensional
Quiver Plots)
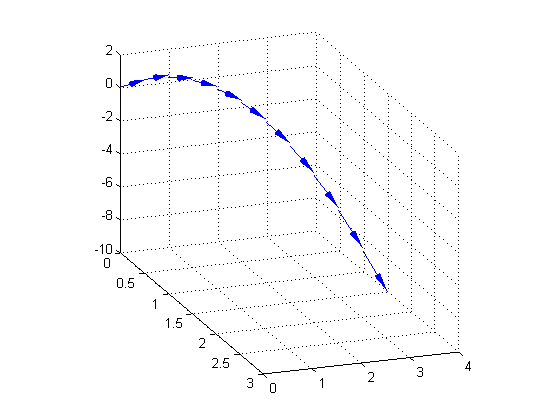
vx=2; vy=3; vz=10; a=-32; t=(0:.1:1)';

x=vx*t; y=vy*t; z=vz*t+1/2*a*t.^2;

r=[x,y,z]; v=gradient(r')';

axis([0 3 0 4 -10 2]), pbaspect([2 1 1])

hold on, grid on, view([70 18])

arrow3(r,r+v,'b',0.9)

hold off
Example 5. Velocity Vectors
 |
Cone
Plots
Example 6. (cf.
Coneplot)
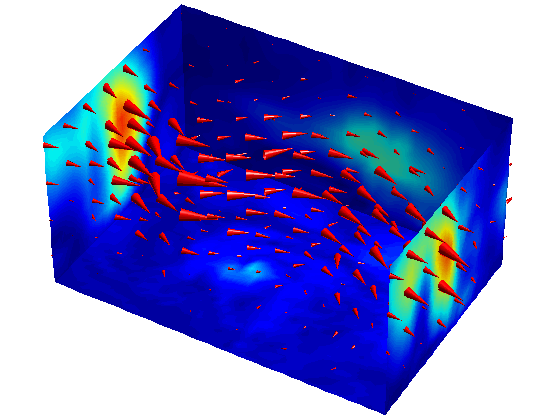
load wind,
wind_speed=sqrt(u.^2+v.^2+w.^2);

xmin=min(x(:)); xmax=max(x(:));

ymin=min(y(:)); ymax=max(y(:));

zmin=min(z(:));

hsurfaces=slice(x,y,z,wind_speed,[xmin,xmax],ymax,zmin);

set(hsurfaces,'FaceColor','interp','EdgeColor','none',...


'AmbientStrength',0.6)

hold on,
daspect([2,2,1]),
view(30,40), axis tight

xrange=linspace(xmin,xmax,8);

yrange=linspace(ymin,ymax,8);

[cx cy cz]=meshgrid(xrange,yrange,3:4:15);

ui=interp3(x,y,z,u,cx,cy,cz);

vi=interp3(x,y,z,v,cx,cy,cz);

wi=interp3(x,y,z,w,cx,cy,cz);

m=sqrt(ui.^2+vi.^2+wi.^2); m=m(:)/30;

p1=[cx(:),cy(:),cz(:)]; p2=[ui(:),vi(:),wi(:)];

hcones=arrow3(p1,p2,'r',m,3*m,'cone');

set(hcones,'DiffuseStrength',0.8)

hold off, axis off

camproj perspective,
camzoom(1.2)

camlight right,
lighting phong
Example 6. Wind Speed and Direction
 |
Example
7. (cf.
Vector
Field Displayed with Cone Plots)
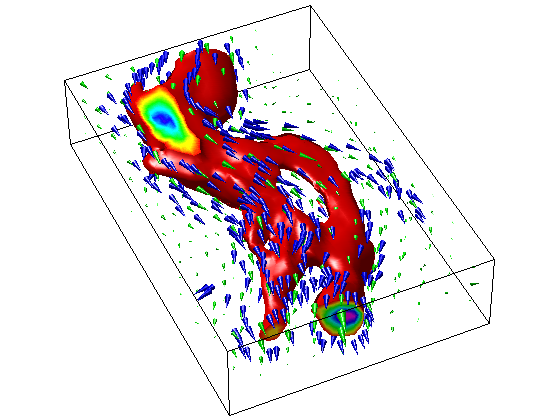
load wind,
wind_speed=sqrt(u.^2+v.^2+w.^2);

hiso=patch(isosurface(x,y,z,wind_speed,40),...


'FaceColor','red','EdgeColor','none');

isonormals(x,y,z,wind_speed,hiso)

hcap=patch(isocaps(x,y,z,wind_speed,40),...

          'FaceColor','interp','EdgeColor','none',...

          'AmbientStrength',0.6);

hold on,
colormap hsv,
daspect([1,1,1]), view(65,45)

[f verts]=reducepatch(isosurface(x,y,z,wind_speed,30),0.07);

cx=verts(:,1); cy=verts(:,2); cz=verts(:,3);

ui=interp3(x,y,z,u,cx,cy,cz);

vi=interp3(x,y,z,v,cx,cy,cz);

wi=interp3(x,y,z,w,cx,cy,cz);

m=sqrt(ui.^2+vi.^2+wi.^2); m=m(:)/40;

p1=[cx(:),cy(:),cz(:)]; p2=[ui(:),vi(:),wi(:)];

h1=arrow3(p1,p2,'b',m,3*m,'cone');

xrange=linspace(min(x(:)),max(x(:)),10);

yrange=linspace(min(y(:)),max(y(:)),10);

[cx,cy,cz]=meshgrid(xrange,yrange,3:4:15);

ui=interp3(x,y,z,u,cx,cy,cz);

vi=interp3(x,y,z,v,cx,cy,cz);

wi=interp3(x,y,z,w,cx,cy,cz);

m=sqrt(ui.^2 + vi.^2 + wi.^2); m=m(:)/50;

p1=[cx(:),cy(:),cz(:)]; p2=[ui(:),vi(:),wi(:)];

h2=arrow3(p1,p2,'g',m,3*m,'cone');

hold off, axis tight, box on

set(gca,'xtick',[],'ytick',[],'ztick',[])

camproj perspective,
camzoom(1.2)

camlight(-45,45), lighting phong
Example 7. Wind Speed and Direction
 |
Feather
Plots
Example 8. (cf.
Feather)
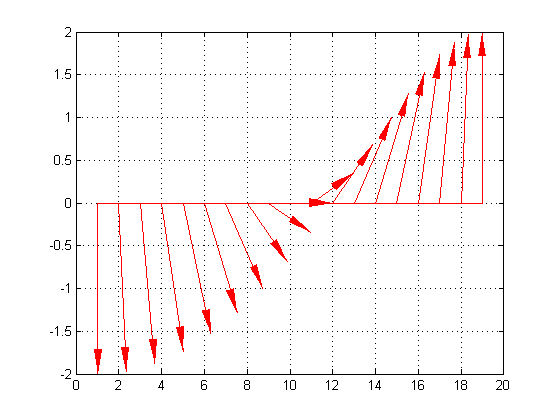
theta=(-90:10:90)'*pi/180;

n=length(theta); p1=[1:n;zeros(1,n)]';

r=2*ones(n,1); [u,v]=pol2cart(theta,r);

plot([1 n],[0 0],'r')

axis([0 20 -2 2]), daspect([8 2 1])

hold on, grid on

arrow3(p1,p1+[u,v],'r',0.9)

hold off
Example 8. Feather Plot
 |
Example
9. (cf.
Plotting
Complex Numbers)
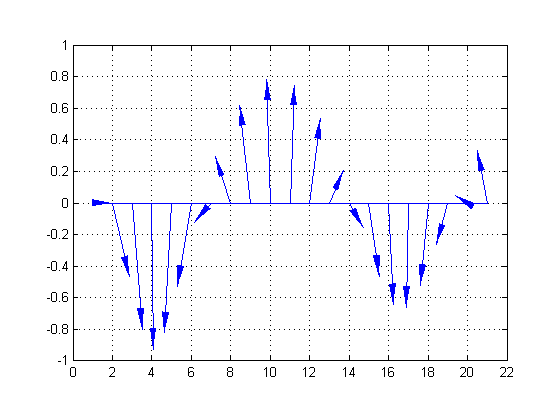
t=(0:0.5:10)'; s=0.05+i; Z=exp(-s*t);

n=length(Z); p1=[1:n;zeros(1,n)]';

plot([1 n],[0 0],'b')

axis([0 22 -1 1]), daspect([8 1 1])

hold on, grid on

arrow3(p1,p1+[real(Z),imag(Z)],'b',0.8)

hold off
Example 9. Complex Number Plot
 |
Compass
Plots
Example 10. (cf.
Compass
Plots)
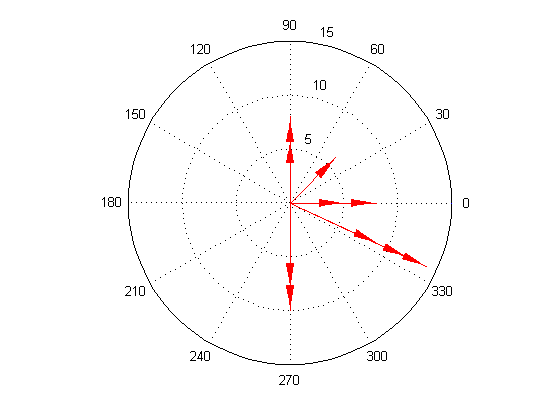
wdir =[45 90 90 45 360 335 360 270 335 270 335 335];

knots=[ 6  6  8  6   5
9   8   8   9  10  14  12];

[x,y]=pol2cart(wdir*pi/180,knots);

polar(0,15), axis(15.9*[-1 1 -1 1])

hold on

arrow3(zeros(length(x),2),[x',y'],'r',1.25)

hold off
Example 10. Wind Speed and Direction
 |
Example
11. (cf.
Compass)
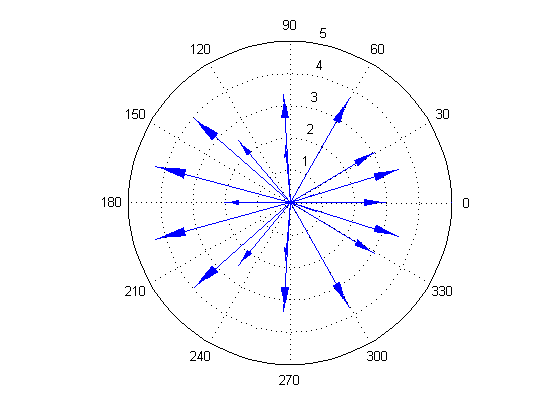
Z=eig(randn(20)); m=abs(Z);

R=ceil(max(m)); r=R+0.3;

polar(0,R), axis(r*[-1 1 -1 1])

hold on

arrow3(zeros(length(Z),2),[real(Z),imag(Z)],'b',1.75*m/R)

hold off
Example 11. Complex Number Plot
 |
Reference
Frames
Example 12. Coordinate Axes
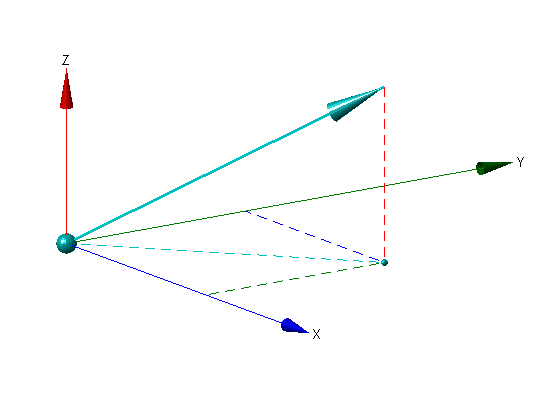
p=[4 2 1]; axis([-6 6 0 5 -1 1])

pbaspect([2 1.5 1]), view(55,15)

hold on

arrow3(repmat([p(1:2),0],4,1),...

  [0 p(2) 0;p(1) 0 0;p;0 0 0],'--o',0,0,0.5)

arrow3(zeros(3),diag([7,5,1]),'o')

arrow3([0 0 0],p,'2.5s',1.5,[],0)

hold off, axis off, camlight left

set(gca,'CameraViewAngle',4)

text(7.1,0,0,'X'),
text(0,5.05,0,'Y')

text(0,0,1,'Z','VerticalAlignment','bottom',...

  'HorizontalAlignment','center')
Example 12. Coordinate Axes
 |
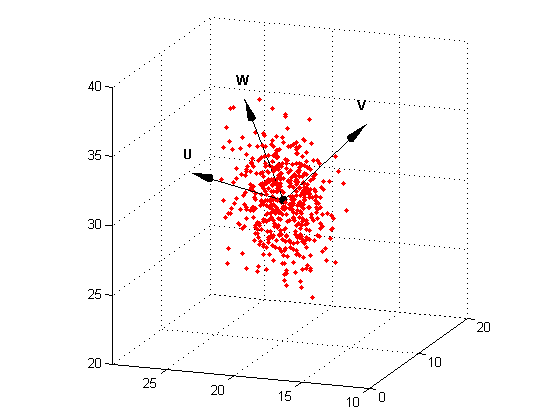
Example 13. Eigenvectors
n=500; % generate test
data

newz=[ 1  1 1]/sqrt(3);

newy=[ 0 -1 1]/sqrt(2);

newx=cross(newy,newz);

R=[newx;newy;newz]; % rotation matrix

U=randn(n,3)*diag([1,2,3])*R;

u=U(:,1)+10; v=U(:,2)+20; w=U(:,3)+30;

% plot eigenvectors with mean
origin

plot3(u,v,w,'r.')

axis([0 20 10 29 20 40]), daspect([1 1 1])

view([-70,15]), set(gca,'CameraViewAngle',8)

hold on, grid on

mu=repmat(mean([u,v,w]),3,1);

[V,D]=eig(cov([u,v,w]));

p=9*V'+mu;

arrow3(mu,p,[],1.25,[],0)

p=p+ones(3);

text(p(1,1),p(1,2),p(1,3),'\bfU')

text(p(2,1),p(2,2),p(2,3),'\bfV')

text(p(3,1),p(3,2),p(3,3),'\bfW')

hold off
Example 13. Eigenvectors
 |
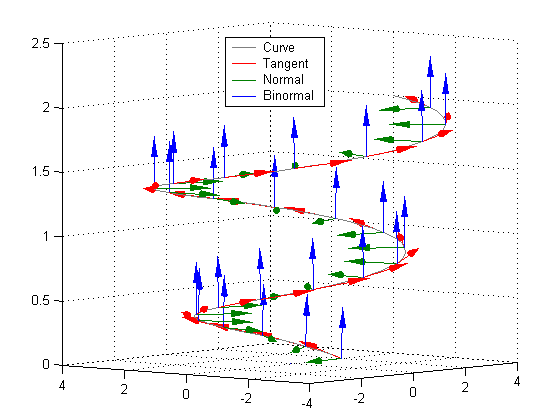
Example 14. (cf.
Frenet)
z=(0:2/99:2)'; t=2*pi*z; r=2+z;

x=r.*cos(t); y=r.*sin(t);

R=[x,y,z]; dR=gradient(R')';

m=repmat(sqrt(sum(dR.*dR,2)),1,3);

T=dR./m; dT=gradient(T')';

m=repmat(sqrt(sum(dT.*dT,2)),1,3);

N=dT./m; B=cross(T,N);

plot3(x,y,z,'color',0.5*[1
1 1])

axis([-4 4 -4 4 0 2.5])

hold on, grid on, pbaspect([1 1 1])

set(gca,'CameraViewAngle',7)

plot3(0,0,0,'r'),
plot3(0,0,0,'color',[0
0.5 0])

plot3(0,0,0,'b')

legend('Curve','Tangent','Normal','Binormal',2)

ndx=1:4:length(x); R=R(ndx,:);

arrow3(R,R+1.4*T(ndx,:),'r',0.9)

arrow3(R,R+1.4*N(ndx,:),'e',0.9)

arrow3(R,R+0.4*B(ndx,:),'b',0.9)

hold off, view(-50,5)

set(gcf,'renderer','zbuffer')
Example 14. Frenet Frames
 |
Named
Colors
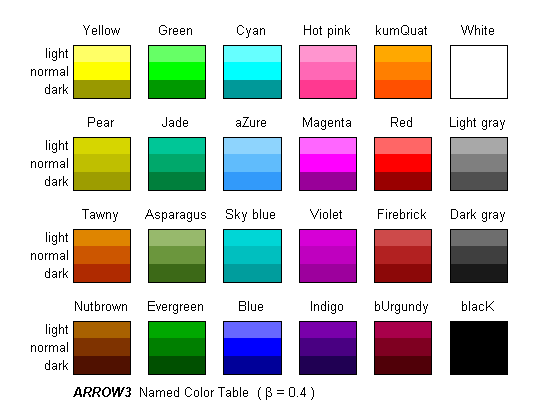
Example
15. Named Color Table
arrow3('colors',0.4)
      % 24 named
colors with
44 adjustable shades
Example 15. Named Color Table
 |
Color
Equivalencies
|
|
|
|
Color1
|
|
Blue
|
LightBlue
|
|
aZure
|
Color2
|
|
Evergreen
|
DarkGreen
|
|
Asparagus
|
Color3
|
|
Red
|
Orange
|
|
kumQuat
|
Color4
|
|
Sky blue
|
Gray
|
|
Light gray
|
Color5
|
|
Violet
|
|
Color6
|
|
Pear
|
|
Color7
|
|
Dark gray
|
|
Update
(Modify and Restore)
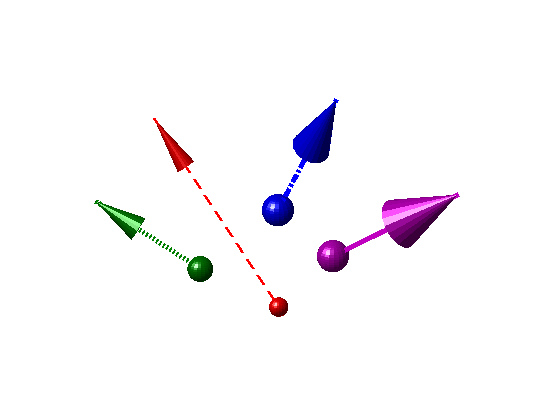
Example 16.
Modify and Restore
% Arrow3 draws surfaces
that appear to be right circular cones and

% spheres, but arrowheads and
initial point markers retain their

% appearance only so long as the
data aspect ratio remains unchanged.

daspect([1 1 2]), view([-40,24])

axis([-1 4 -1 4 0 6])

hold on, axis off

p1=[0,0,0;2,1,0;2.5,3,0;0,2,0];

p2=[-1,2,6;3,-1,3;2.5,1.5,5;-1,3.5,2];

global LineWidthOrder,
LineWidthOrder=[2,3,3,3];

global ColorOrder,
ColorOrder='rvbe';

w=[3,8,6,4]; h=[9,12,12,8]; ip=[3,5,5,4];

set(gca,'LineStyleOrder',{'--','-','-.',':'},...

  'position',get(gca,'position')+[0,0.075,0,0])

arrow3(p1,p2,'o*/',w,h,ip)

hold off

camlight left
Example 16. (a) Original plot
 |
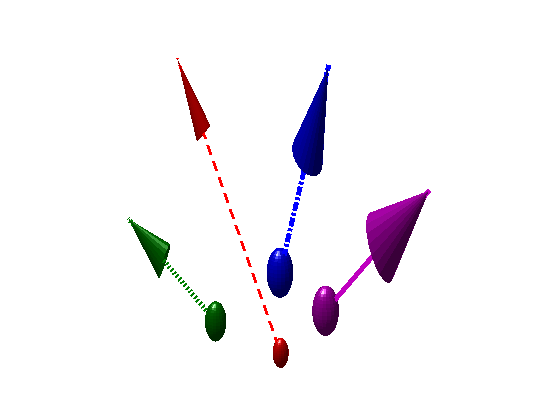
% Changing the data aspect
ratio distorts the appearance of
arrowheads

% and initial point markers.

daspect([1 1 1])
Example 16. (b) Aspect ratio distortion
 |
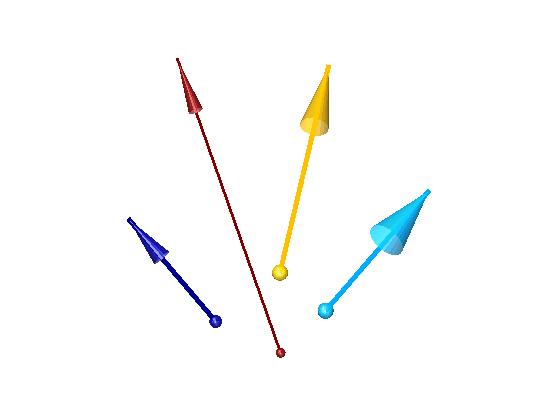
% Restore appearance of
arrowheads and initial point markers.

arrow3('update')

% Modify colors of arrowheads,
initial point markers, and lines to

% conform with magnitude
coloring in the current colormap.

h=arrow3('update','colors');

% Change line style to
continuous.

set(h(strcmp(get(h,'type'),'line')),'LineStyle','-')

% Reduce arrowhead width by 25%,
retain arrowhead height, and reduce

% initial point marker diameter
by 50%.

arrow3('update',[0.75,1,0.5]);

% Reduce opacity to 70%.

set(h,'FaceAlpha',0.7)

camlight head
Example 16. (c) Updated plot
 |
See also
Arrow3 Messes Up My
Plots!


