Visualization of directional data (2D) using arrows.
Visualization of directional data (2D) using arrows.

| kmlStr = ge_quiver(X,Y,U,V) |
| kmlStr = ge_quiver(X,Y,U,V,Parameter,Value) |
| kmlStr = ge_quiver(X,Y,U,V) |
Draws arrows at locations specified by "X" (longitude) and "Y" (latitude). The direction of each arrow is determined from its components "U" (positive in the direction of positive longitude) and "V" (positive in the direction of positive latitude).
| kmlStr = ge_quiver(X,Y,U,V,Parameter,Value) |
In addition to the above, this syntax also allows for specification of a number of parameters regarding the appearance of the data when viewed in Google Earth. Assigning values to the parameters can be accomplished by inclusion of an alternating sequence of parameters and their value. The table below provides an overview of the authorized options. The order in which the parameters are included does not matter. Please be aware that the options are case-sensitive. Examples are provided further down.
| Parameter | Description |
| 'altitude' | Height difference relative to the plane of reference (see parameter 'altitudeMode'). |
| 'altitudeMode' | Specifies which plane of reference to use. Must be one of 'absolute', 'relativeToGround' or 'clampToGround'. |
| 'description' | A description of objects can be included using this parameter. Its value must be passed as a character array. It will be displayed in the Google Earth Viewer within a pop-up text balloon. |
| 'extrude' | See Extruding objects. |
| 'msgToScreen' | Defines whether verbose feedback is provided by the function when it is accessed and when it finishes. Default is false (which is equivalent to logical(0), but quicker). |
| 'lineColor' | Line color specification, including transparency. Color value format must be passed as a character array according to the format string 'TTBBGGRR', with 'TT' representing transparency; 'BB', 'GG', and 'RR' representing blue, green, and red color intensity, respectively. Intensity values are denoted as two-digit hexadecimal numbers ranging from 00 to FF. For example, '0000FF00' is fullly transparent green and 'FF0000FF' is fully opaque red. |
| 'lineWidth' | Width of the line that is used for drawing the arrows. |
| 'magnitudeScale' | Scales the length of the arrows. If D is the length of an arrow expressed as a fraction of the length of the longest arrow in the whole data set, then by default 'magnitudeScale' is set to 95% of D times the smallest distance between points in the data set. If the data comprises only 1 point, the 'magnitudeScale' parameter is set to 1. |
| 'name' | This character array will be used within the Google Earth Viewer 'Places' pane to identify objects. |
| 'snippet' | A short description of the feature. In Google Earth, this description is displayed in the Places panel under the name of the feature. If a Snippet is not supplied, the first two lines of the description are used |
| 'timeSpanStart' | See Dynamic visualization. |
| 'timeSpanStop' | See Dynamic visualization. |
| 'visibility' | Whether the object is initially visible. Must be passed to ge_quiver() as a numerical value 1 or 0. Visibility state can be changed within the Google Earth Viewer by clicking the object's checkmark in the 'Places' pane. |
Latitudes on the Southern hemisphere must be passed as negative values. Same for longitudes on the Western hemisphere.
Latitudes and longitudes should be passed in units of decimal degrees (also known as fractional degrees). Google Earth uses Simple Cylindrical projection (also known as Plate Carée) with a WGS84 datum. Altitudes must be passed in meters.
See the demo file demo_ge_quiver for more details.
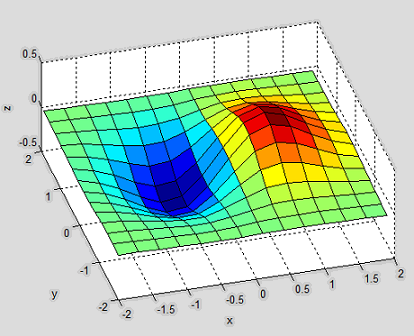
First, we calculate a surface according to:
res = 0.3;

[X,Y] = meshgrid(-2:res:2);
Z = X.*exp(-X.^2 - Y.^2);
That yields the surface as displayed in the image below.
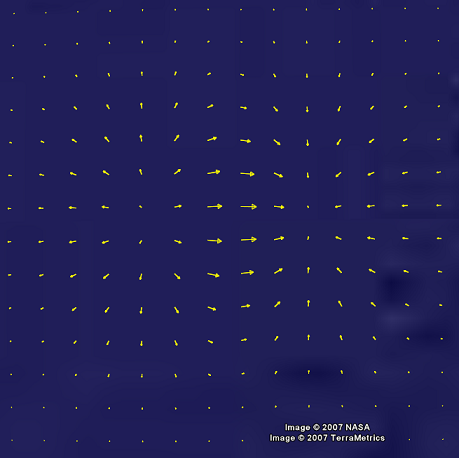
Next, we calculate the spatial gradient at each point according to MATLAB's gradient() function. Subsequently passing variables "X", "Y", "U", and "V" to ge_quiver() and using ge_output() to generate a kml file...
[U,V] = gradient(Z,res,res);

kmlStr = ge_quiver(X,Y,U,V,...
               'lineColor','ffffff00',...
               'lineWidth',1.2,...
                'altitude',50000,...
             'msgToScreen',true);

ge_output('example_ge_quiver.kml',kmlStr);
...will yield the following when viewed in Google Earth: