Visualizing points in 3D space.
Visualizing points in 3D space.

| kmlStr = ge_point(X,Y,Z) |
| kmlStr = ge_point(X,Y,Z,Parameter,Value) |
| kmlStr = ge_point(X,Y,Z) |
Visualizing points in 3D space. Coordinates must be passed to ge_point() as identically sized numerical arrays "X" (longitude), "Y" (latitude), and "Z" (elevation).
| kmlStr = ge_point(X,Y,Z,Parameter,Value) |
In addition to the above, this syntax also allows for specification of a number of parameters regarding the appearance of the data when viewed in Google Earth. Assigning values to the parameters can be accomplished by inclusion of an alternating sequence of parameters and their value. The table below provides an overview of the authorized options. The order in which the parameters are included does not matter. Please be aware that the options are case-sensitive. Examples are provided further down.
| Parameter | Description |
| 'altitudeMode' | Specifies which plane of reference to use. Must be one of 'absolute', 'relativeToGround' or 'clampToGround'. |
| 'dataFormatStr' | This parameter specifies how the numbers in the pop-up balloon will be displayed. Default is '%g'. See docsearch('sprintf') for information about formatting numbers. Value of the parameter is only relevant when numel(X)==1, see under 'description'. |
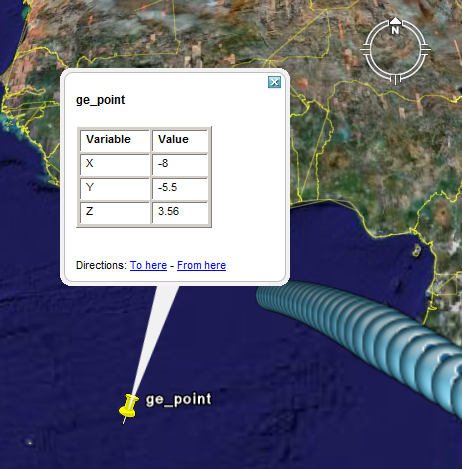
| 'description' | A description of objects can be included using this parameter. Its value must be passed as a character array. It will be displayed in the Google Earth Viewer within a pop-up text balloon. When only one point is passed to ge_point(), the default value is a table containing the coordinates; when multiple points are passed at ge_plot(), the default value of parameter 'description' is a null string (description='';). |
| 'extrude' | See Extruding objects. |
| 'iconColor' | Backgroundcolor of the icon. |
| 'iconScale' | Scaling parameter of the icon. |
| 'iconURL' | Link to image file to use as icon. On Windows, the icons are usually stored locally at "C:\Program Files\Google\Google Earth\res\" (folders "paddle", "pal2", "pal3", "pal4" and "pal5"). By using 'iconURL', you can point to these local files, but for improved portability, use their online equivalents; to do so, replace "C:\Program Files\Google\Google Earth\res\" in the value assigned to 'iconURL' with "http://maps.google.com/mapfiles/kml/". |
| 'msgToScreen' | Defines whether verbose feedback is provided by the function when it is accessed and when it finishes. Default is false (which is equivalent to logical(0), but quicker). |
| 'pointDataCell' | By default, the popup balloon contains the values of "X" (longitude), "Y" (latitude), and "Z" (elevation); Other data about the point can be instead put into the table with "pointDataCell" parameter. Its value should be a Nx2 cell array of strings. |
| 'name' | This character array will be used within the Google Earth Viewer 'Places' pane to identify objects. |
| 'tableBorderWidth' | This parameter specifies the borderwidth of the table in the pop-up balloon. Default is 1. Can only be used when numel(X)==1. Default is 1. |
| 'snippet' | A short description of the feature. In Google Earth, this description is displayed in the Places panel under the name of the feature. If a Snippet is not supplied, the first two lines of the description are used |
| 'timeSpanStart' | See Dynamic visualization. |
| 'timeSpanStop' | See Dynamic visualization. |
| 'visibility' | Whether the object is initially visible. Must be passed to ge_box() as a numerical value 1 or 0. Visibility state can be changed within the Google Earth Viewer by clicking the object's checkmark in the 'Places' pane. |
Latitudes on the Southern hemisphere must be passed as negative values. Same for longitudes on the Western hemisphere.
Latitudes and longitudes should be passed in units of decimal degrees (also known as fractional degrees). Google Earth uses Simple Cylindrical projection (also known as Plate Carée) with a WGS84 datum. Altitudes must be passed in meters.
See the demo file demo_ge_point for more details.
The source code below draws a series of points along a vertical spiral.
The above will generate a *.kml file that draws the specified icon at the points specified by [sin(t),cos(t),t*1e6]. In addition to that, it will also draw a single point at location [-8,-5.5,3.56]. Since this is a single point, a table containing the coordinates is included by default in the pop-up balloon.