Add a colorbar to the Google Earth Viewer.
Add a colorbar to the Google Earth Viewer.

| kmlStr = ge_colorbar(PosLon,PosLat,M) |
| kmlStr = ge_colorbar(PosLon,PosLat,M,Parameter,Value) |
| kmlStr = ge_colorbar(PosLon,PosLat,M) |
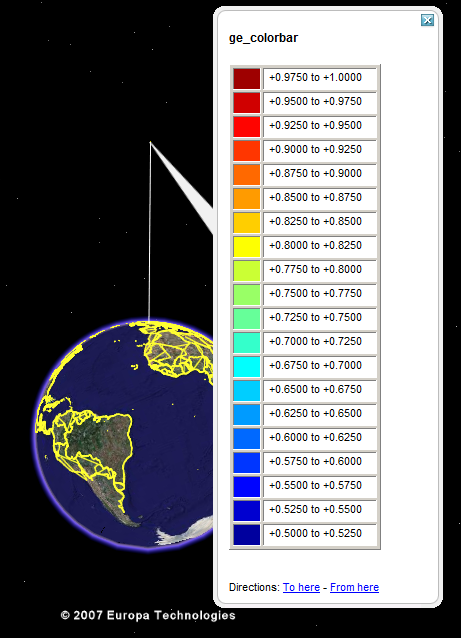
Adds a colorbar to the Google Earth Viewer. The location of the colorbar can be specified in the variables "PosLon" (longitude) and "PosLat" (latitude). Variable "M" contains the numerical data that the colorbar refers to.
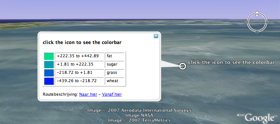
Colorbars are visualized within a text balloon. When collapsed, the location of the text balloon is indicated by a PlaceMark symbol (see image below).
| kmlStr = ge_colorbar(PosLon,PosLat,Parameter,Value) |
In addition to the above, a number of options can be set regarding the appearance of the colorbar. Assigning values to the parameters can be accomplished by inclusion of an alternating sequence of parameters and their value. The table below provides an overview of the authorized options. The order in which the parameters are included does not matter. Please be aware that the options are case-sensitive. Examples are provided further down.
| Parameter | Description |
| 'altitude' | Height difference relative to the plane of reference (see parameter 'altitudeMode'). Default is 'clampedToGround'. |
| 'altitudeMode' | Specifies which plane of reference to use. Must be one of 'absolute', 'relativeToGround' or 'clampToGround'. |
| 'cBarBorderWidth' | Specifies border width of the colorbar HTML table displayed in the pop-up window. Default is 1. |
| 'cBarFormatStr' | This parameter specifies how the numbers on the colorbar are displayed. Default is '%g'. See docsearch('sprintf'). |
| 'cLimHigh' | Specifies the value to which the maximum of the colorbar should apply. Default is max(M(:)). |
| 'cLimLow' | Specifies the value to which the minimum of the colorbar should apply. Default is min(M(:)). |
| 'cMap' | Specifies the colormap to use for visualizing the grid cell colors. Default is 'jet', but any MATLAB colormap can be used. |
| 'extrude' | Connects the colorbar PlaceMark symbol to the surface of the Earth by a thin line. See example here. |
| 'labels' | Scalar, or N-array, equal in length to the levels provided/generated. This is user defined, and should be a cell array of character string elements. |
| 'msgToScreen' | Defines whether verbose feedback is provided by the function when it is accessed and when it finishes. Default is false (which is equivalent to logical(0), but quicker). |
| 'name' | This character array will be used within the Google Earth Viewer 'Places' pane to identify objects. |
| 'nanValue' | Specifies which value in input variable "M" should be treated as Not-a-Number (NaN). |
| 'numUnits' | Specifies number of color classes to be used for the colorbar. Default is 15. |
| 'timeSpanStart' | See Dynamic visualization. |
| 'timeSpanStop' | See Dynamic visualization. |
| 'visibility' | Whether the object is initially visible. Must be passed to ge_box() as a numerical value 1 or 0. Visibility state can be changed within the Google Earth Viewer by clicking the object's checkmark in the 'Places' pane. |
Latitudes on the Southern hemisphere must be passed as negative values. Same for longitudes on the Western hemisphere.
Use imagesc() in combination with ge_colorbar() to indicate to what values the colors in the map correspond.
When you customize the appearance of a map, make sure to assign identical values to parameters 'cMap', 'cLimLow', and 'cLimHigh' in the call to ge_imagesc() and ge_colorbar().
Latitudes and longitudes should be passed in units of decimal degrees (also known as fractional degrees). Google Earth uses Simple Cylindrical projection (also known as Plate Carée) with a WGS84 datum. Altitudes are in meters.
See the demo file demo_ge_colorbar for more details.
Also see under ge_imagesc().