View source code of the function ge_axes() in the MATLAB editor
Google Earth toolbox contents

ge_axes

Visualization of grid lines. Axes can be Cartesian (but with distortion due to projection type) or radial (also with distortion). Combinations of the following planes can be generated at once: xy, xz, and yz. For each plane, a separate folder will be created containing grid lines at the specified locations. In addition to the Cartesian axes, a radial axis can be specified as well, namely that of heading (i.e. direction on a compass).

Syntaxgo to top

kmlStr = ge_axes('axesType',S)
kmlStr = ge_axes('axesType',S,Parameter,Value)

Descriptiongo to top

kmlStr = ge_axes('axesType',S)

Draws the grid lines of the axes specified by parameter 'axesType'. Set the value of S to combinations of the letters 'x', 'y', and 'z' in order to draw Cartesian axes. Set S to 'h' for a directional plot (heading). For each axis included in input variable "S", you need to specify the locations of the tick marks (or equivalently, of the grid lines) using their respective parameters ('xTick', 'yTick' and 'zTick' for Cartesian; 'hTick' for radial). The grid lines of each plane will be organized into a separate folder bearing the name of the plane (e.g. 'xy-plane'). This will make it easier to enable or disable an entire plane in one mouseclick when viewing them in Google Earth.

kmlStr = ge_axes('axesType',S,Parameter,Value)

In addition to the above, a number of options can be set regarding the appearance of the grid lines. Assigning values to the parameters can be accomplished by inclusion of an alternating sequence of parameters and their value. The table below provides an overview of the authorized options. The order in which the parameters are included does not matter. Please be aware that the options are case-sensitive. Examples are provided further down.

ParameterDescription
'altitudeMode'Character array used in interpreting the position of objects along the vertical axis. Value can be one of 'clampToGround', 'relativeToGround', or 'absolute'. Default is 'relativeToground'.
'axesOrigin'Numerical array of length 3, specifying the location where xy, xz, and yz planes intersect. Required when input parameter "S" consists of only 2 unique entries. Default is [min(xTick),min(yTick),min(zTick)] for Cartesian axes; for radial axes, 'axesOrigin' is always user-specified.
'axesType'See description above.
'hAxisLength'Length of the axis in a heading plot in units of degrees.
'hLineColor'Line color specification for the grid lines in a heading plot. Includes transparency. Overrules 'lineColor'.
'hTick'Defines the position of the grid lines. Must be passed to 'ge_axes' in units of degrees.
'lineColor'Line color specification, including transparency. Color value format must be passed as a character array according to the format string 'TTRRGGBB', with 'TT' representing transparency; 'RR', 'GG', and 'BB' representing red, green, and blue colors, respectively. Intensity values are denoted as two-digit hexadecimal numbers ranging from 00 to FF. For example, '80FF0000' is semi-transparent red and 'FF0000FF' is fully opaque blue. Default is 25% white.
'lineWidth'Line width specification. Must be passed as a 1x1 numerical array. Default is 1.
'msgToScreen'Defines whether verbose feedback is provided by the function when it is accessed and when it finishes. Default is false (which is equivalent to logical(0), but quicker).
'xTick'Defines the position of the grid lines on the x-axis. Must be passed to 'ge_axes' in units of degrees.
'xyLineColor'Line color specification, including transparency. Overrules 'lineColor' for the xy-plane grid lines.
'xzLineColor'Line color specification, including transparency. Overrules 'lineColor' for the xz-plane grid lines.
'yzLineColor'Line color specification, including transparency. Overrules 'lineColor' for the yz-plane grid lines.
'yTick'Defines the position of the grid lines on the y-axis. Must be passed to 'ge_axes' in units of degrees.
'zTick'Defines the position of the grid lines on the z-axis. Must be passed to 'ge_axes' in units of meters.

Remarksgo to top

Latitudes on the Southern hemisphere and longitudes on the Western hemisphere must be passed as negative values.

Some transformation may occur due to the projection.

Examplesgo to top

See the demo file demo_ge_axes for more details.


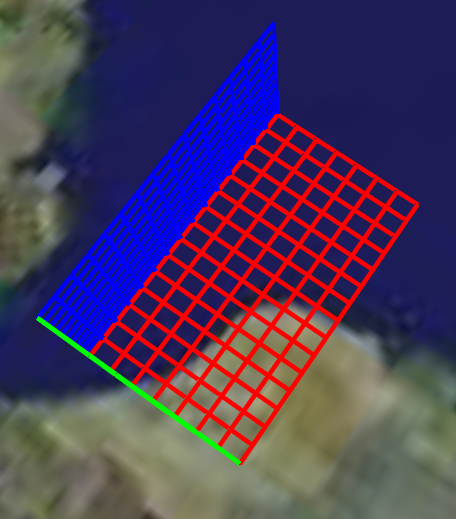
kmlStr = ge_axes('axesType','xyz',...
                    'xTick',5+[0:0.2:1.5],...
                    'yTick',52+[0:0.1:1.5],...
                    'zTick',[4e5:1e4:5e5],...
              'msgToScreen',true,...
              'xyLineColor','FF0000FF',...
              'xzLineColor','FF00FF00',...
              'yzLineColor','FFFF0000',...
                'lineWidth',3);
                

ge_output('demo_ge_axes.kml',kmlStr);

The above lines of code will display as follows when viewed in Google Earth: